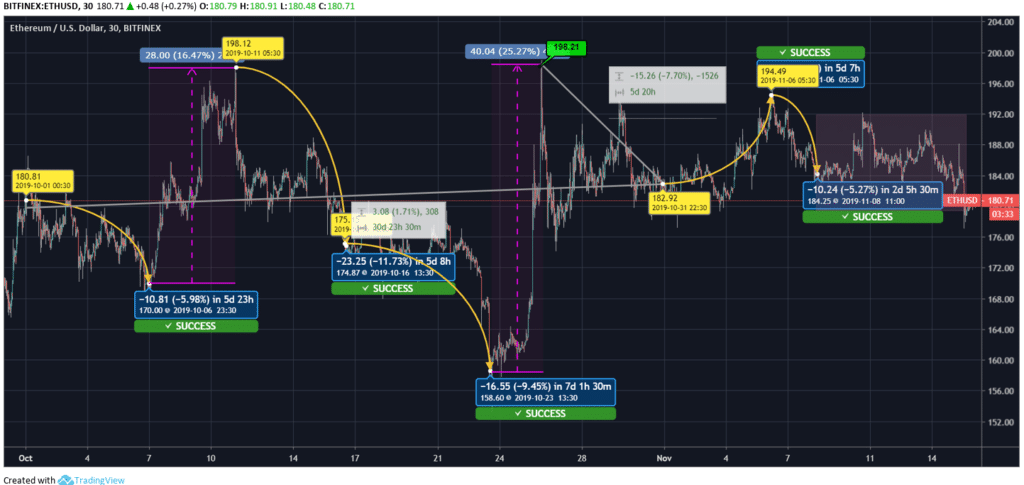
The market has been marking the hasty movement for a long time. The big forces of the market are shattered due to the same. The bitcoin price is currently at $8,500. It was seen touching $13,000 in the past. However, if we look at Ethereum, the coin has tried harder, and hence is currently locked around $180. To understand the momentum more precisely, let’s have a look at the monthly chart of ETH coin:

Ethereum Price Analysis
As per the price trend of Ethereum, the coin is spotted moving in a straight line with in-between peep-ups. The ETH coin started dealing at $180.81 on October 01, 2019. The price slipped to $170 by 5.98%. Later, the price escalated to $198.12 by 16.47%. The currency couldn’t hold itself at the level and fell to $174.87 by 11.73%. The fall remain intact and took the price of Ethereum to $158.60 by 9.45%. The ETH price jumped to $198.21 by 25.27% in the later days. In the last few days, ETH’s price slipped back to $182.92 by 7.70%. The coin registered 1.71% progression. The ongoing month started with escalation in ETH. The price counters moved from $182.92 to $194.49 by 6.22%. However, later, the price dropped again and touched $184.25. The regression marked was 5.27%. Recently, the coin is seen moving around the same level of $180.
Ethereum price movement has a past of satisfying the traders. The coin price anticipated to improve in the coming days. For intraday trading, the ETH coin is moving towards the immediate support level at $177.85.
| Resistance Level | Price | Support Level | Price |
| R1 | $184.72 | S1 | $177.85 |
| R2 | $188.92 | S2 | $175.18 |
| R3 | $191.59 | S3 | $170.98 |
The interested traders are recommended for opting for long-term investment. The short-term investment might not give the assumed result; hence we wouldn’t vote for the same.